
The Bureau of Labor Statistics reported that the May inflation rate was 0.1% and the year over year headline inflation rate was 4%. Excluding food and energy prices the year over year inflation was 5.3%.
Energy prices declined in May and from a year ago keeping a lid on overall consumer price inflation. That’s the good news. The bad news is prices are still increasing and eating into the salary increases for most Americans.
Nevertheless, there is a major flaw in calculating the CPI. The all expenditures table lumps all prices consumers pay for goods and services, even items that are purchased infrequently, e.g., automobiles, furniture, appliances, computers, etc. These goods fall into a category I call “consumer capital goods,” because they have a long life. Goods and services that are regularly purchased reflect the increases or decreases in the “cost of living.” This would more accurately reveal the monthly decline of the American people’s purchasing power.
Thus, the BLS should calculate a separate list of goods that consumers purchase occasionally, such as a single-family residence (house or condo), automobiles, computers, furniture, appliances, etc. Year to year changes would indicate how the Fed’s easy and tight money policies have been affecting the price of so-called big-ticket items.
In addition, there should be a separate category for taxes paid by individuals and families. This could be labeled the “cost of citizenship”—even if someone is not yet a naturalized citizen. But you get the picture. What does it cost the American people to pay for local, state, and federal government spending—and debt? I will discuss this in an upcoming column.
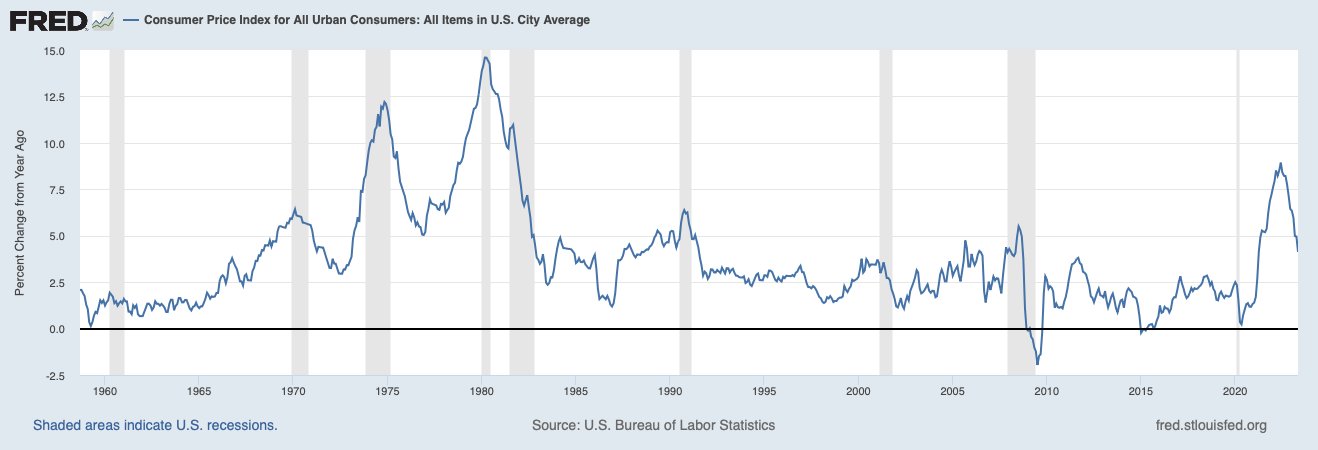
So where are we in the inflation cycle? The following chart suggests an inflation cycle has just begun and could last more than a decade like the one that started in the mid-1960s and ended in the early 1980s. Why? As price inflation decelerates a recession often occurs. The Fed then pumps money into the economy to stimulate production and consumption and we are off to the races. The gray bars are periods of recession.
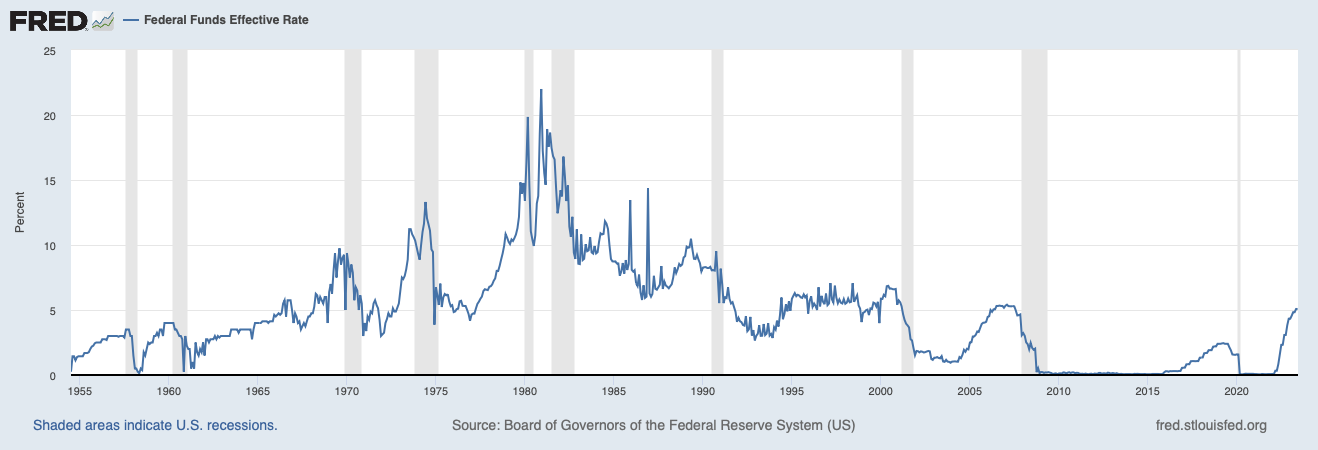
The Fed meets this week to discuss the state of the economy and whether it will pause hiking interest rates. If it pauses, it could signal that it expects a recession soon. The next chart shows when the fed funds rate, which the Fed sets, stops rising, a recession is typically on the horizon or already underway. (See chapter 4, Wash, Rinse, Repeat in Navigating the Boom Bust Cycle.)
My latest piece on the economy was published in Fortune, https://fortune.com/2023/03/27/recession-2023-layoffs-tech-finance-unemployment-outlook-fed-rates-murray-sabrin/ This is an update of my 2021 forecast, https://fortune.com/2021/12/09/next-recession-heres-everything-bubble-markets-2021-2022-covid-murray-sabrin/
Murray Sabrin, PhD, is emeritus professor of finance, Ramapo College of New Jersey. Dr. Sabrin is considered a “public intellectual” for writing about the economy in scholarly and popular publications. His new book, The Finance of Health Care: Wellness and Innovative Approaches to Employee Medical Insurance (Business Expert Press, Oct. 24, 2022), and his other BEP publication, Navigating the Boom/Bust Cycle: An Entrepreneur’s Survival Guide (October 2021), provides decision makers with tools needed to help manage their businesses during the business cycle. Sabrin's autobiography, From Immigrant to Public Intellectual: An American Story, was published in November, 2022.